

FinChat.io is The Excel Plugin Alternative
The FinChat dashboard has everything you need to replace your excel plugins.
It's no secret that investors love Excel. But tracking and managing your portfolio with Excel Plugins takes time.
For example, if you want to track certain growth metrics or keep an eye on a stock's valuation as the price changes, you have to build those spreadsheets out manually.
With the FinChat dashboard, that's all done for you.
Tracking Growth
One way investors tend to use plugins on Microsoft Excel or Google Sheets is to monitor the progress of certain metrics like revenue, net income, shares outstanding, and other financial measures.
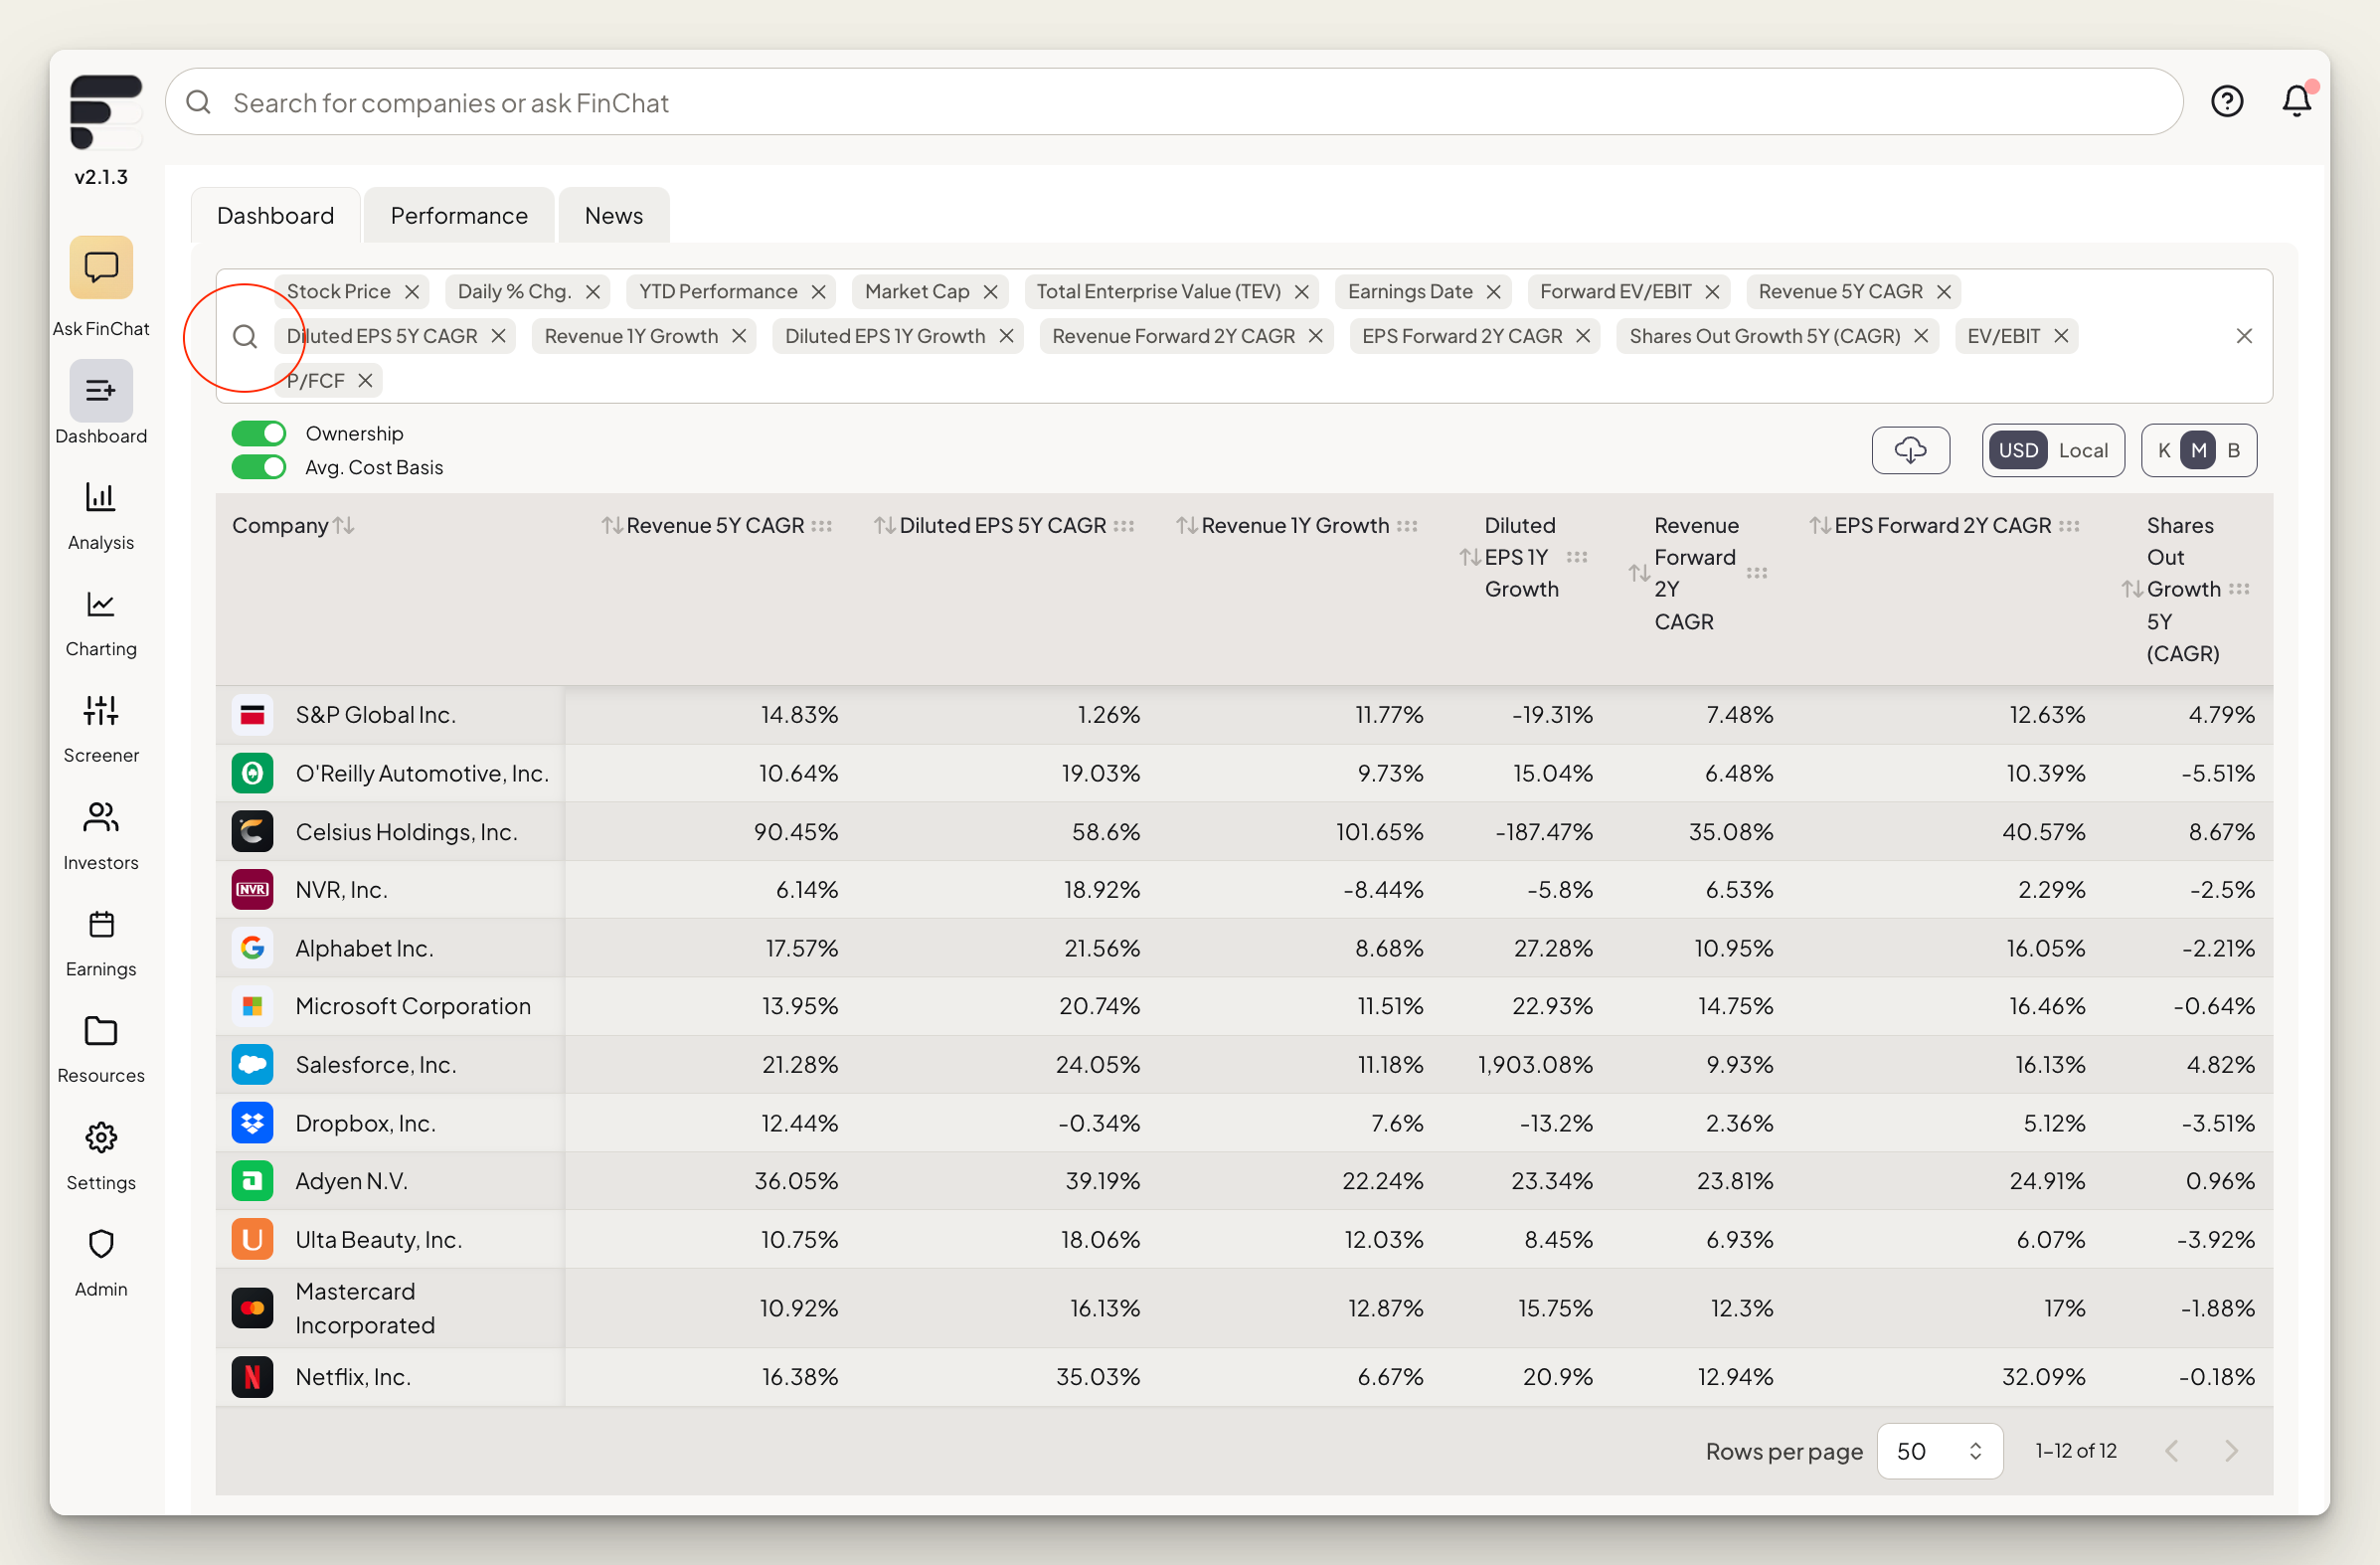
On the FinChat Dashboard, all those numbers are tracked for you. All you have to do is simply select the companies and metrics you like. FinChat has more than 500 metrics and 50,000 active companies to choose from.
Some popular metrics include:
- Revenue CAGR (10-year, 5-year, 3-year, or 1-year)
- EPS CAGR (10-year, 5-year, 3-year, or 1-year)
- Profit Margins (Net Margin, Operating Margin, Free Cash Flow Margin, etc.)
- Expected Revenue Growth
- Shares Outstanding.
But it doesn't stop there.
Thanks to FinChat's one-of-a-kind data library, users can also see more granular Segment & KPI data. This includes metrics like Monthly Active Users, Cloud Revenue, Same-Store Sales, and plenty others.
 Source: https://finchat.io/dashboard/
Monitoring Valuations
Aside from tracking growth statistics, many investors use Excel/Google Sheets plugins to keep an eye on the valuations of certain companies as their stock prices fluctuate.
FinChat has real-time prices on more than 50,000 stocks globally, so by pairing this with our wide range of valuation metrics, you can now keep a close eye on valuations right from your dashboard.
When a stock price moves, you'll know automatically what the valuation looks like. FinChat has hundreds of valuation metrics to choose from but some of the most popular metrics include:
- Price to Earnings
- Price to Free Cash Flow
- Enterprise Value to EBIT
- Enterprise Value to Forward EBIT
- Dividend Yield
- Buyback Yield
Exporting and Copying
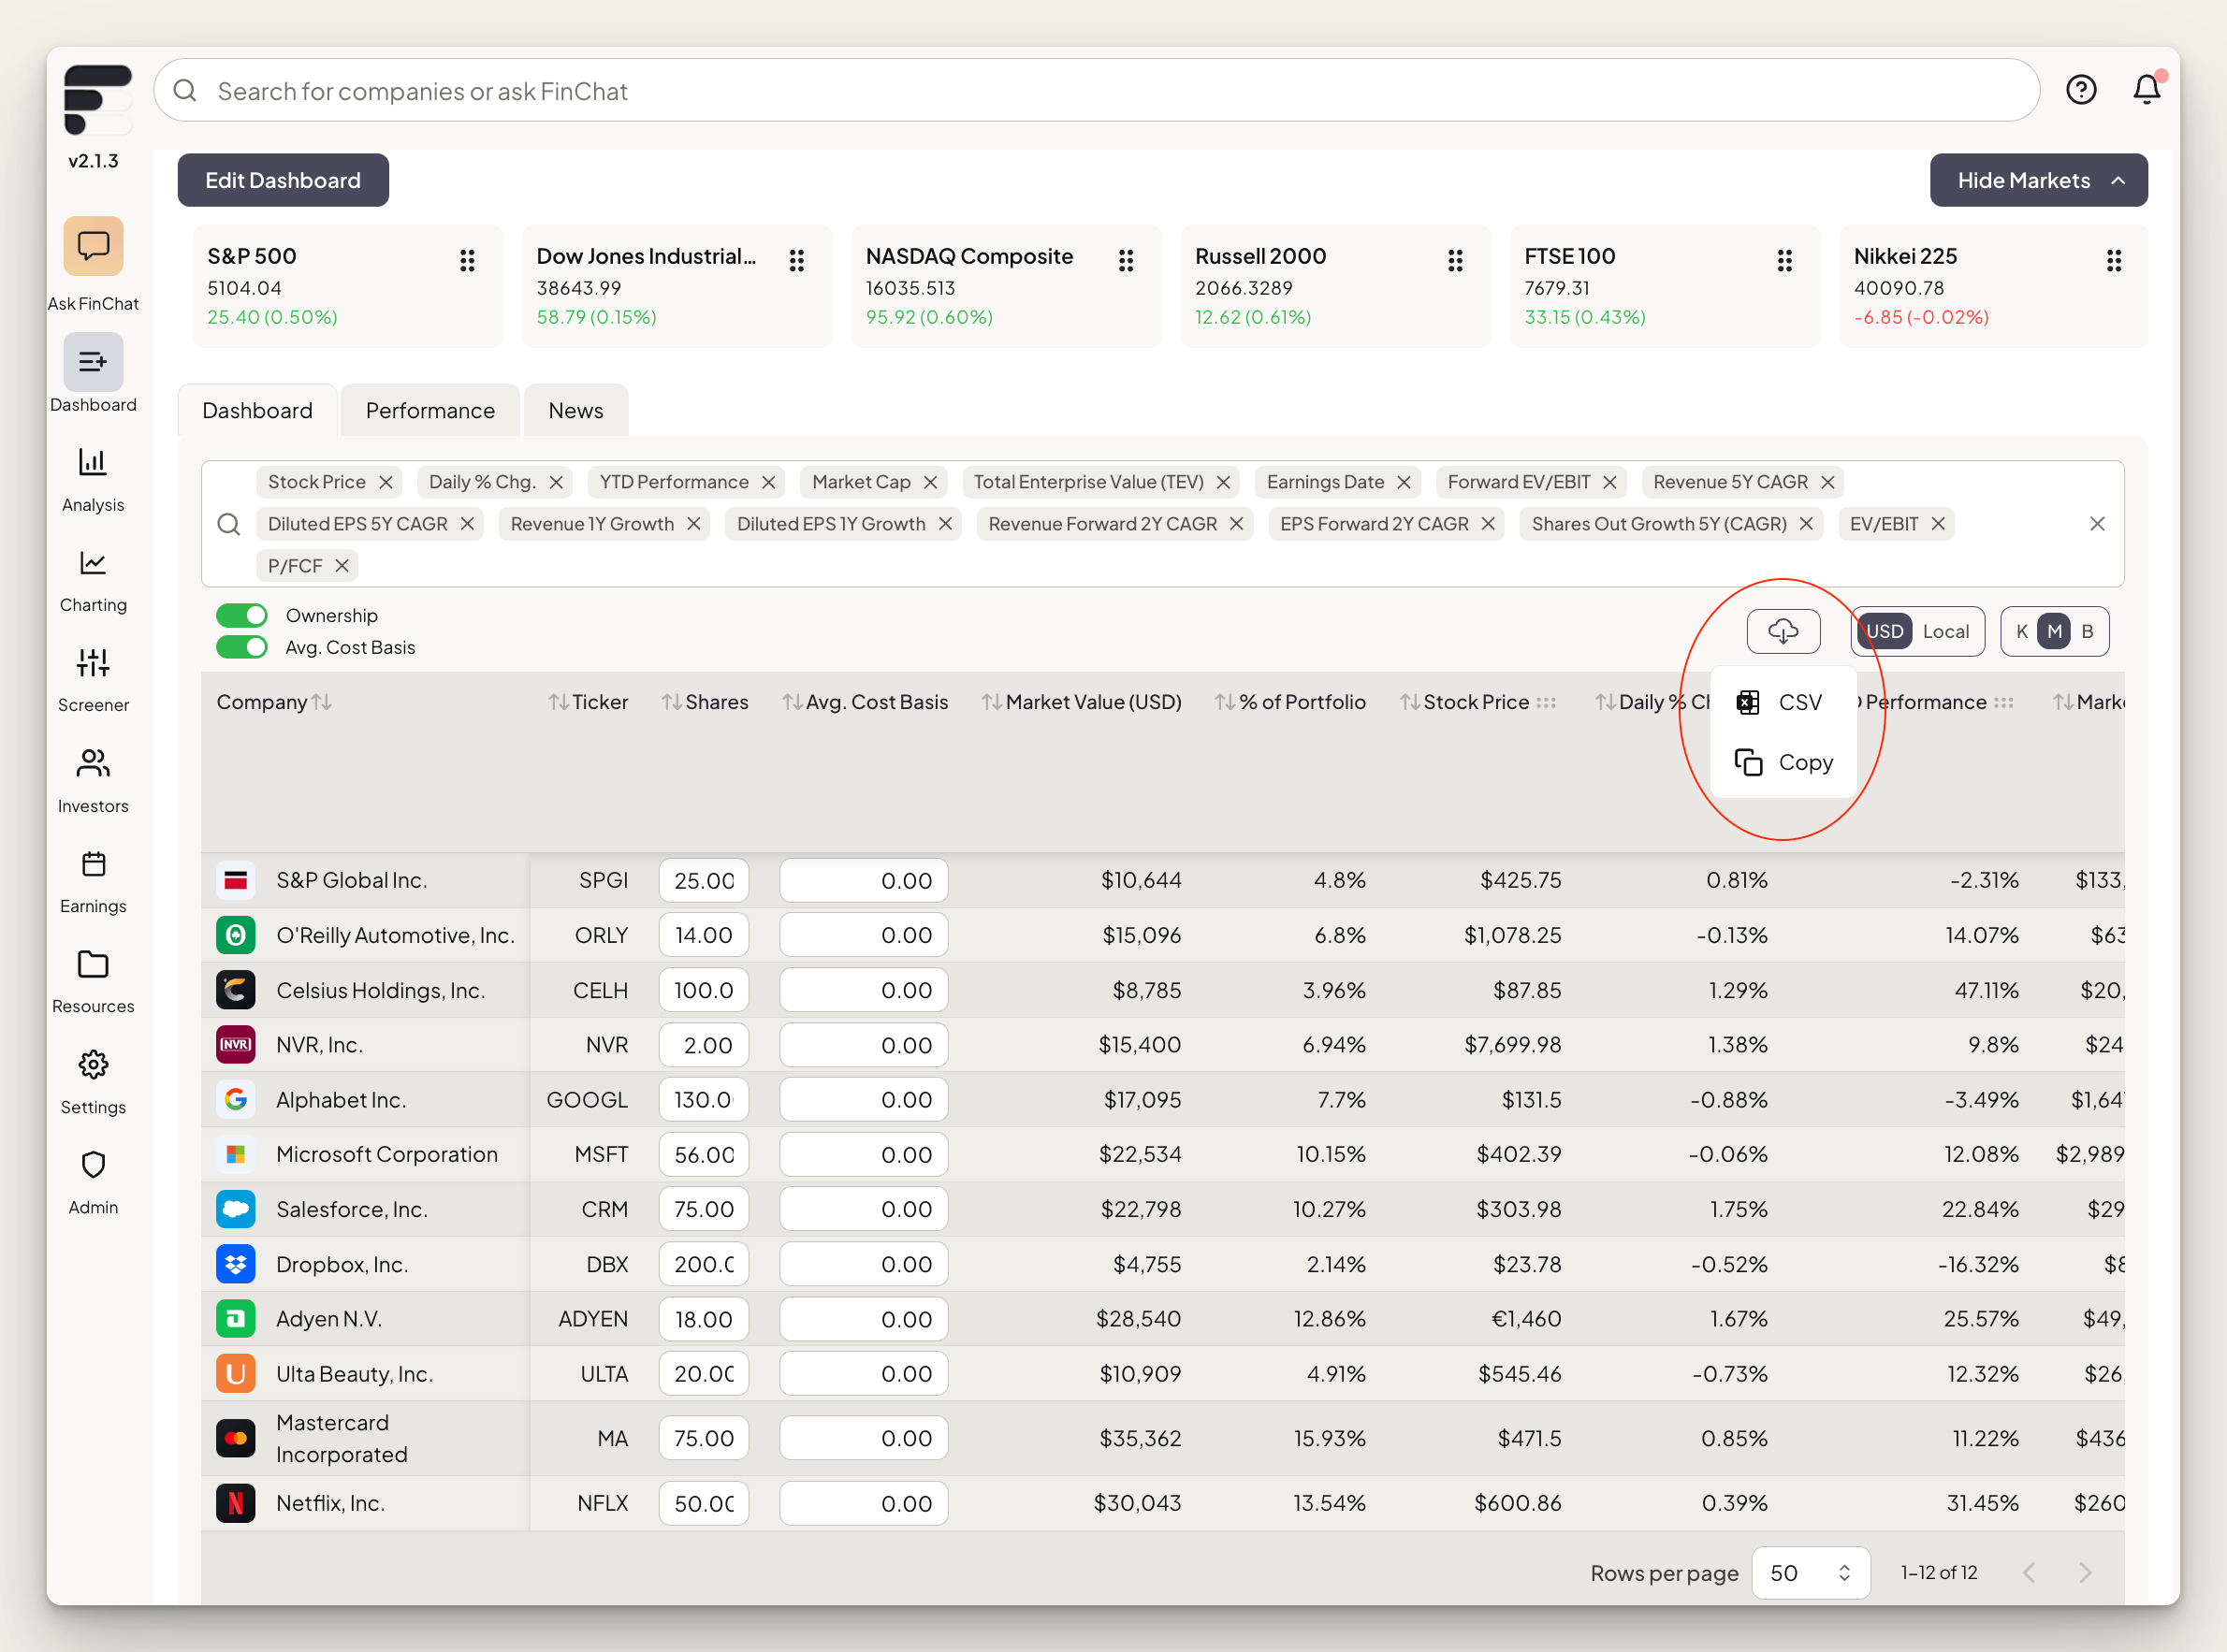
While FinChat users can keep track of everything from within their dashboard, we realize some investors still love to maintain their spreadsheets in Excel and Google Sheets. That's why we've made it easy to export or copy the entire dashboard.
By simply clicking on the download button (circled in red), you can either export your dashboard as a CSV file or copy the data to port over to your own spreadsheet.
 Source: https://finchat.io/dashboard/
Visualizing Portfolios
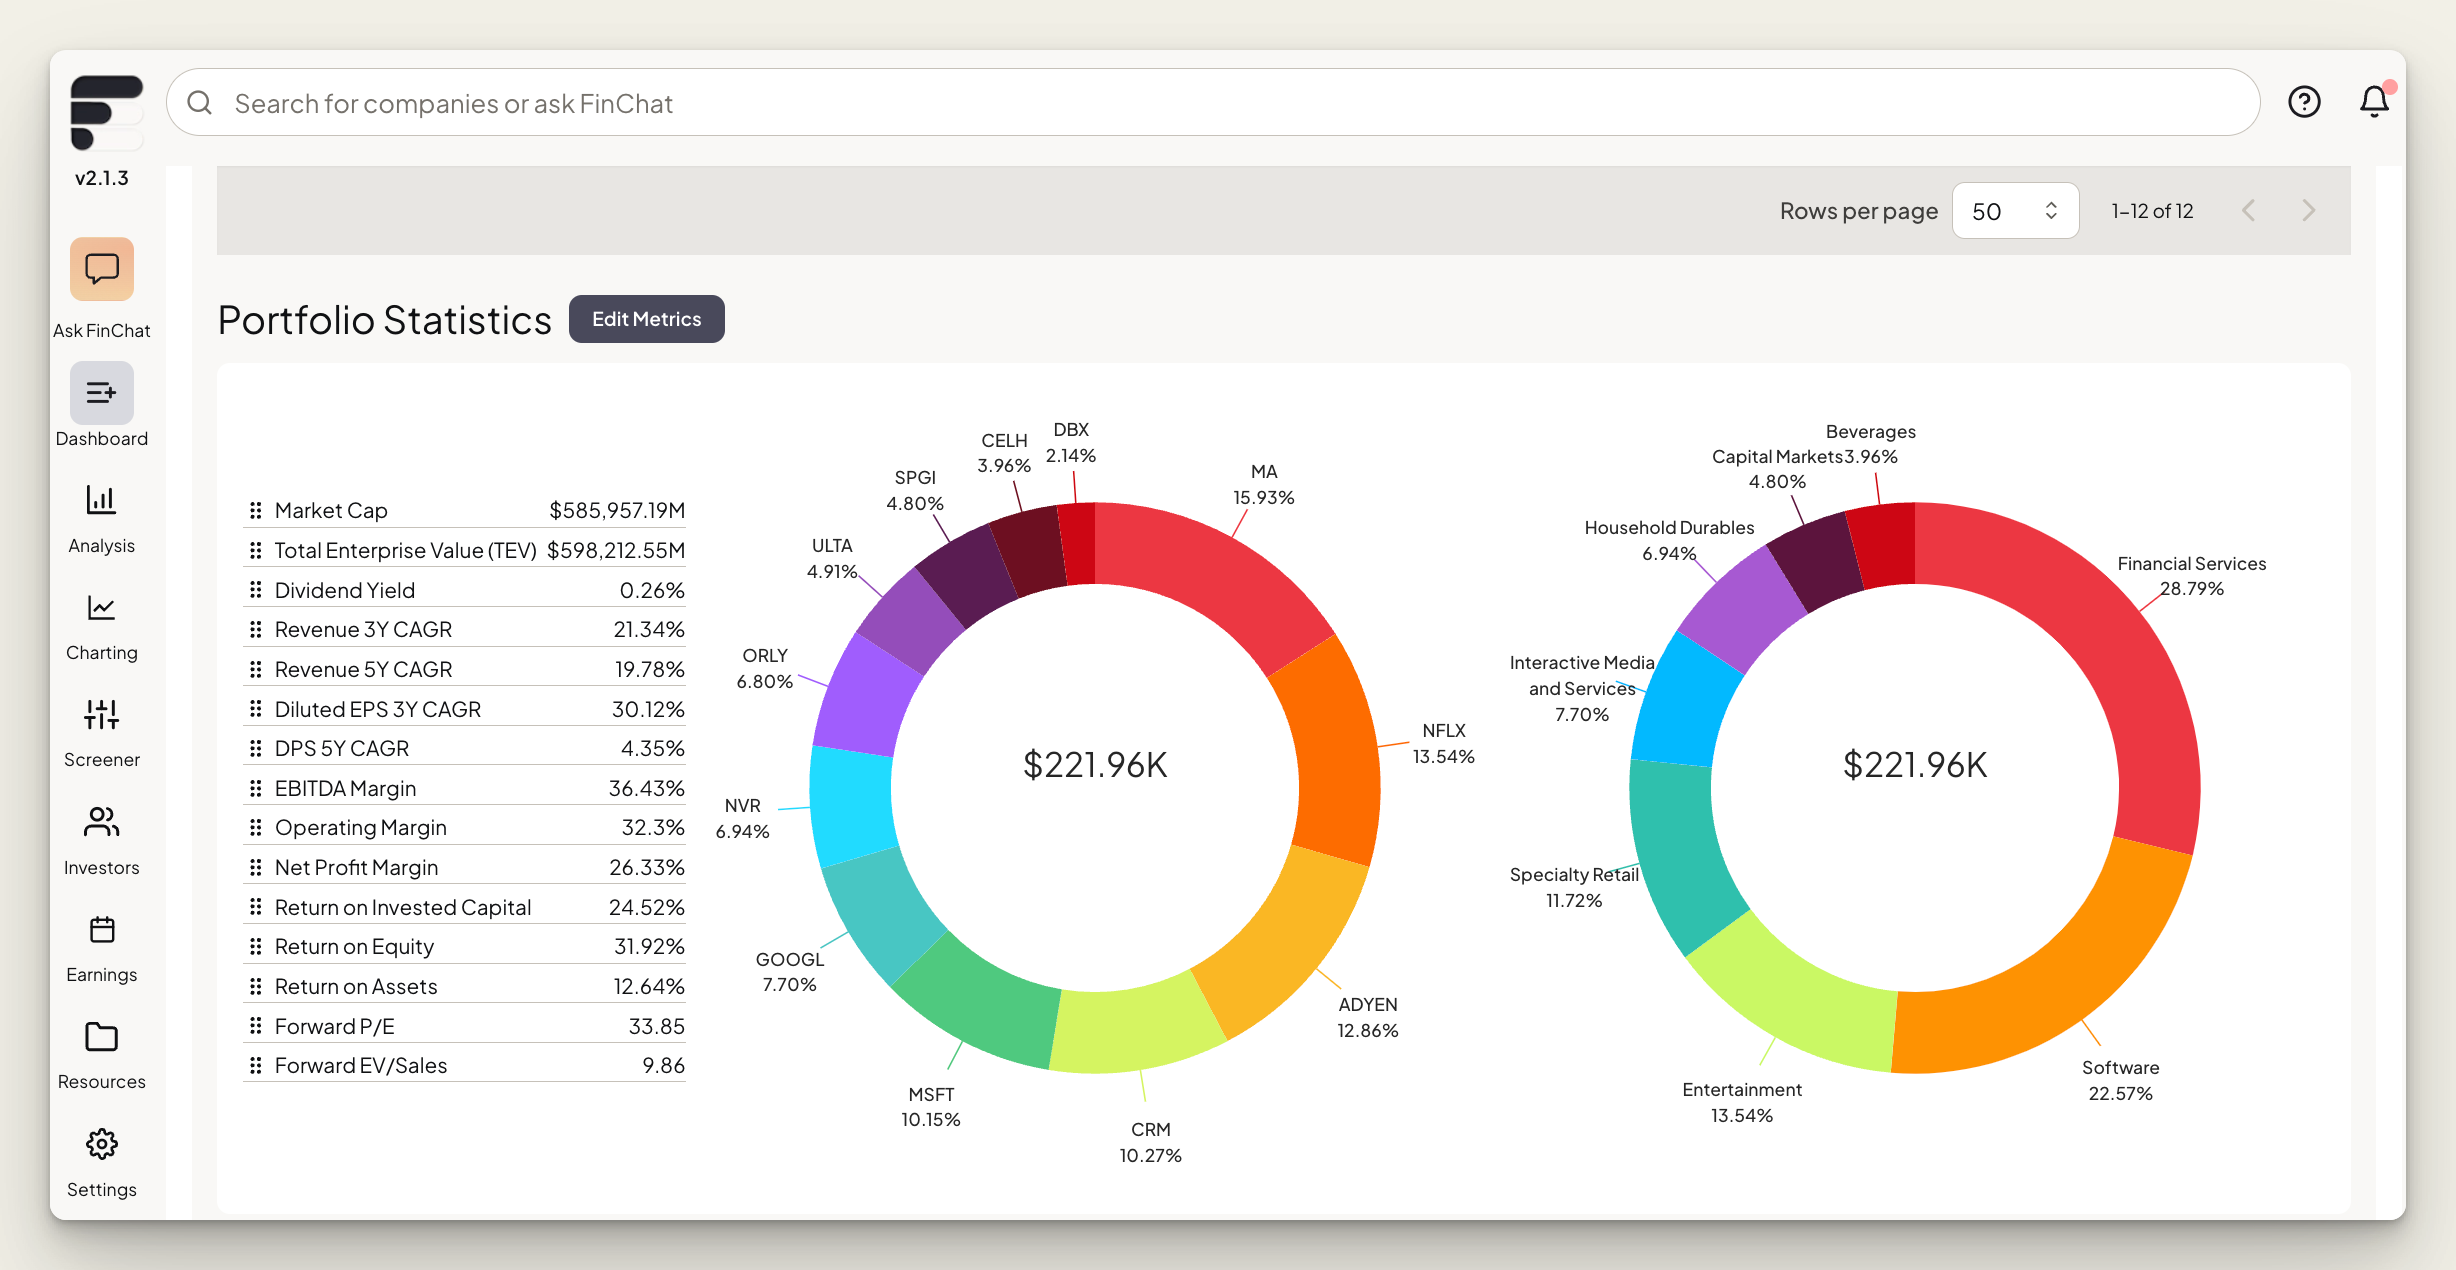
Though the most common use cases for Excel/Sheets plugins are tracking financials, we've noticed that some investors also like to visualize their portfolios with pie charts.
Since FinChat aims to be the one-stop-shop for all investors' needs, we brought this in-house.
 Source: https://finchat.io/dashboard/
By keeping everything in one place investors can track their portfolio performance, measure their companies' progress, monitor valuation multiples, all while utilizing the powerful FinChat research terminal to find potential new investments.
Not only is this a superior experience to alternating between disparate systems, but it also saves tons of time.
In fact, we conducted experiments with professional investors to determine how long it would take them to get 10+ years of financials from other platforms and 10+ years of company specific KPIs.
On average, it was 90x faster to use FinChat.io.
To get 2 weeks of FinChat Pro for free, simply sign up below.