
How To Use FinChat: A Guide for Investors
FinChat is the all-in-one research platform for fundamental investors.
While we're proud to offer all the data and resources an investor might need, we realize it can also be a little overwhelming for new users.
That's why we've created this step-by-step guide to help you get the most out of our powerful platform.
We'll go through the 6 most important features of the FinChat experience one at a time.
Quick aside: If you prefer video format, our CEO Braden Dennis and Growth & Content Lead Ryan Henderson, also put together this longer-form tutorial demonstrating the unique capabilities of the FinChat platform.
Let's get started.
Step 1: Set up your Dashboard
The dashboard is where you will begin your journey every time you sign in. Think about it as your investing homescreen.
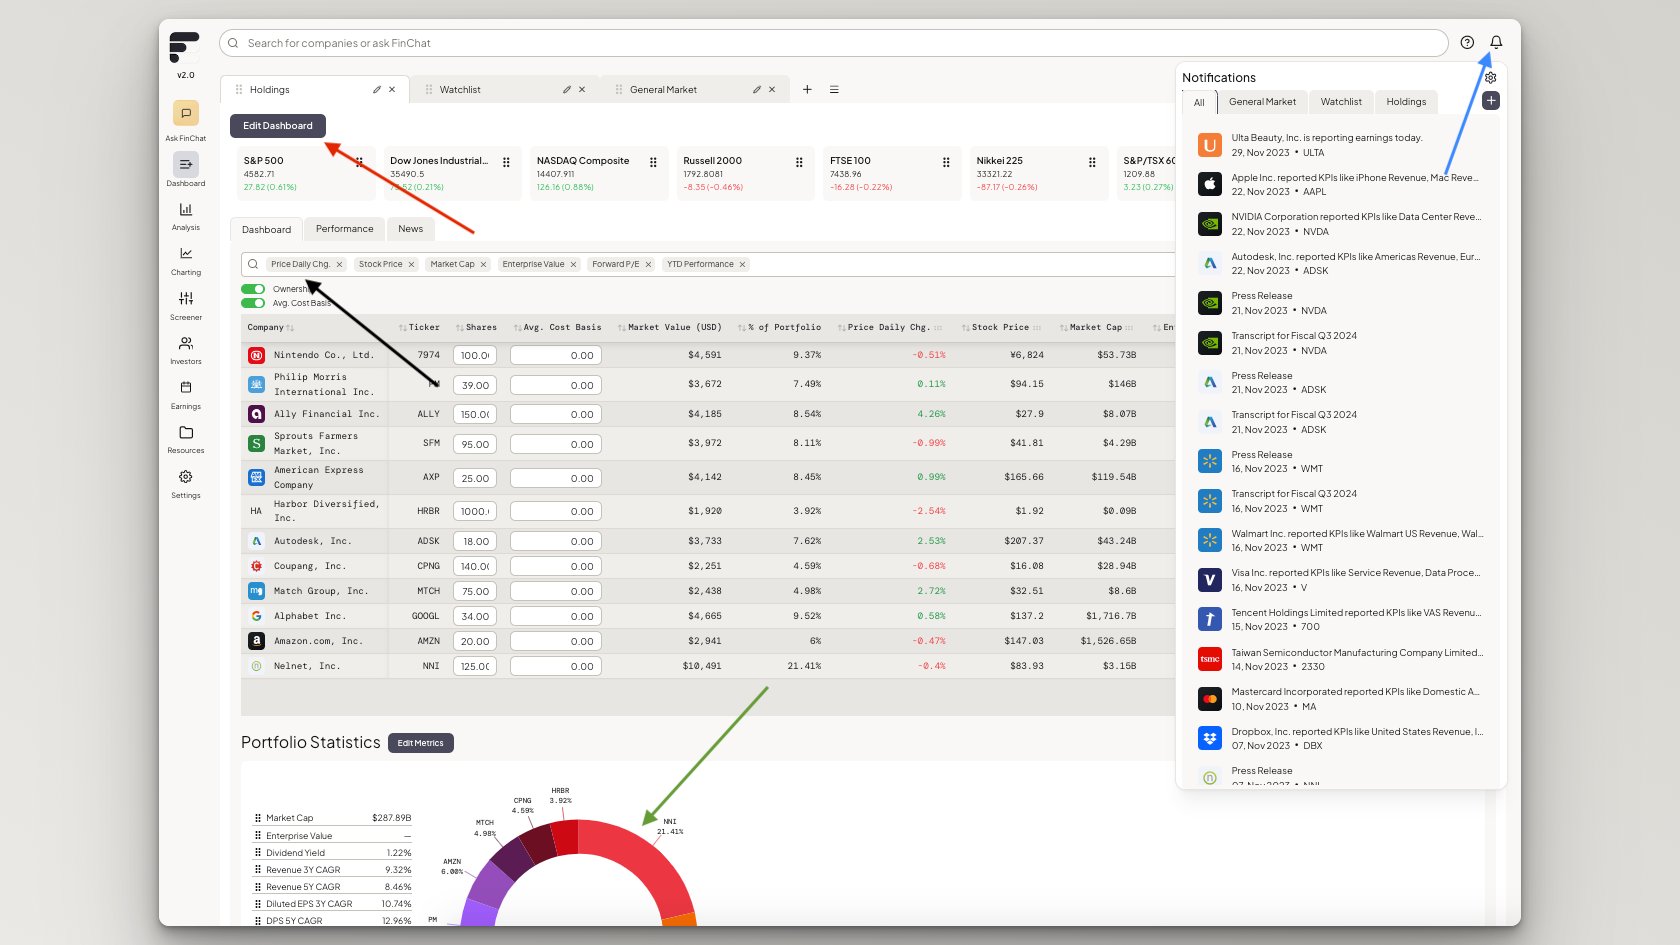
You can add companies to your dashboard by hitting the "Edit Dashboard" button in the top-left corner as shown by the red arrow in the picture below. Once you're happy with your list of companies, we suggest adding or subtracting metrics that are relevant to you in the search bar at the top of your dashboard, as shown by the black arrow.
Sorting by metrics that are relevant to you can enable you to have a more useful watchlist and a more pleasant experience overall.
Additionally, by inserting the number of shares you own for each position you can get a beautiful pie chart depicting your overall portfolio, as shown by the green arrow.
Lastly, in order to help you keep up with all the stocks you own or just like to track, we've built a notifications tab in the top right corner of your dashboard as shown by the blue arrow. This will allow you to get notifications for items like press releases, SEC filings, conference calls, and other newsworthy announcements.
Step 2: Analyze a company
For fundamental investors, this is probably where you'll spend the majority of your time.
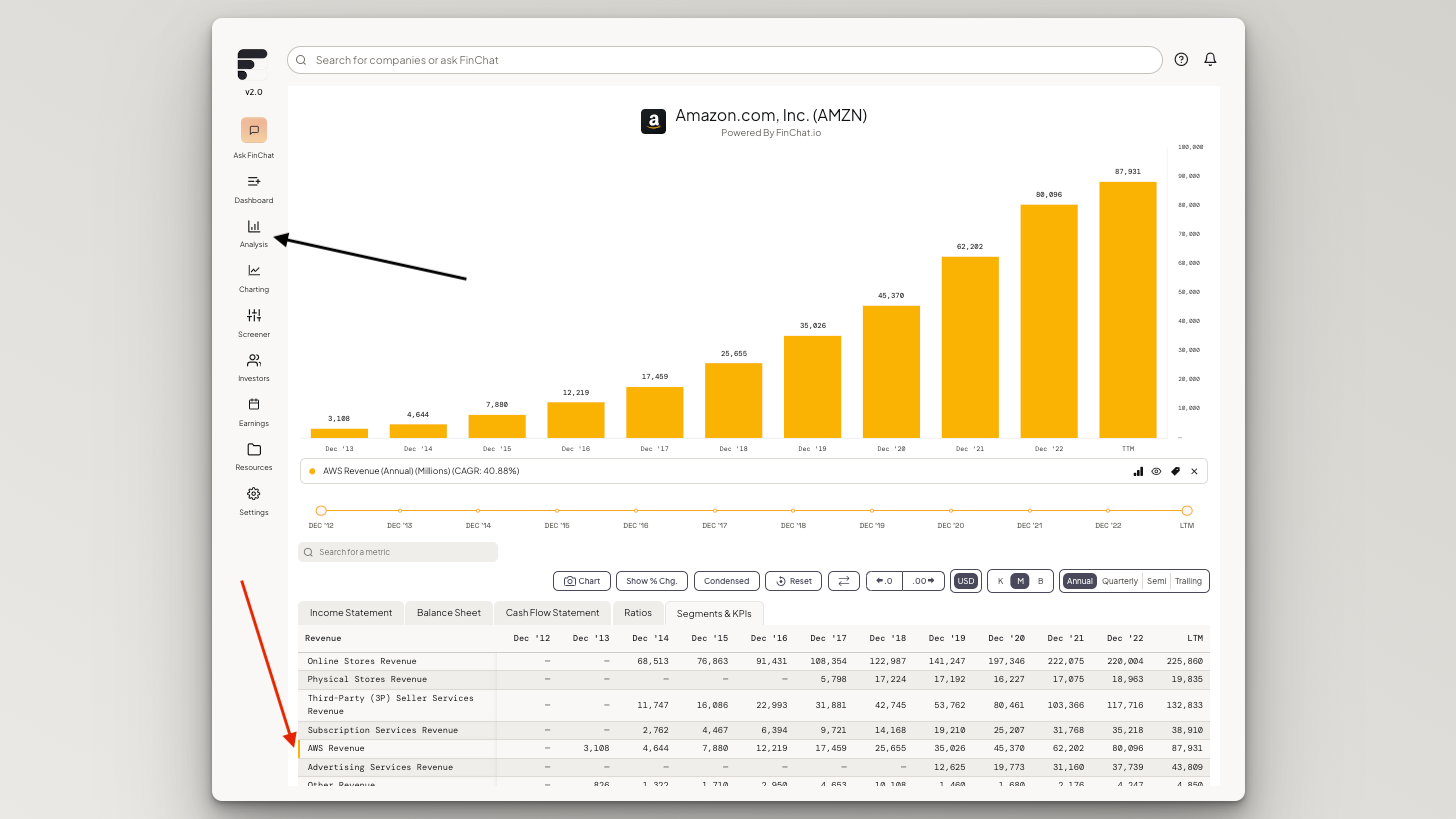
To get a glimpse at all the important data for any business, simply search the company name or ticker in the search bar at the top of FinChat.
Once you've picked your company, you'll see a comprehensive overview of everything that's important to that stock or business. This will include 10+ years of standard financial statements, as well as any company specific metrics that are tracked. We have company-specific KPIs on more than 1,000 stocks, so try it out on any company you follow!
For example, to see Amazon's AWS revenue, you can click on the "Segments & KPIs" tab and select AWS Revenue, as shown by the red arrow. That will instantly populate a chart showing AWS's revenue performance over the last 10 years.
To see the company's ownership table, peer group, analyst estimates, or plenty more, you can access each of those through the side bar as shown with the black arrow or at the top of the page.
Step 3: Ask FinChat
At any point that you're on our platform, our conversational AI assistant will be there to help.
Our AI assistant is a powerful tool for investment research. It's a way to greatly reduce the time requirements for data aggregation, visualization, and summaries.
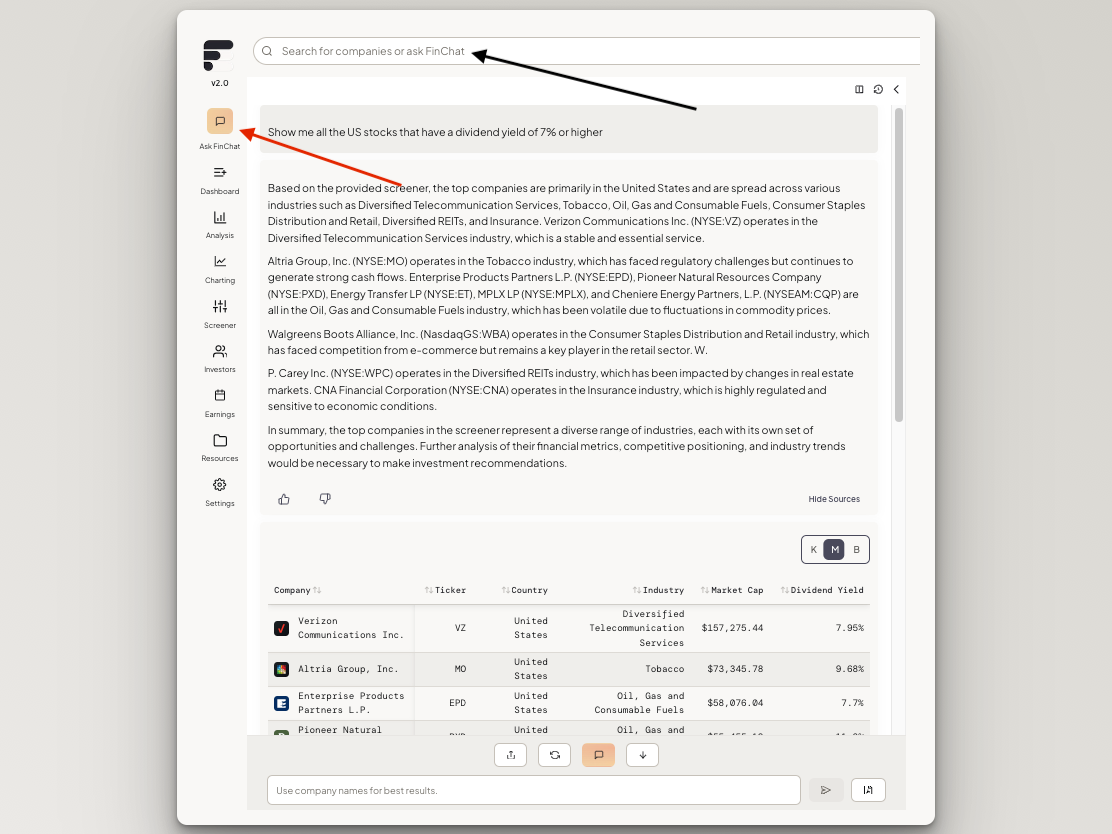
To ask FinChat a question, simply click the gold "Ask FinChat" icon in the top left corner of the screen (shown by the red arrow) or type your question into the search bar at the top (shown by the black arrow).
FinChat can answer prompts like:
- "Summarize Microsoft's last quarter with a focus on the cloud business. Include transcripts from CEO Satya Nadella."
- "What does legendary fund manager Terry Smith hold?"
- "Show me all the US stocks that have a dividend yield of 7% or higher."
And way, way more.
Test it out for yourself. I think you'll be pretty surprised by the range of queries that FinChat can handle.
Step 4: Share Charts
For anyone who likes to share their research or investment ideas, FinChat makes it easy and customizable.
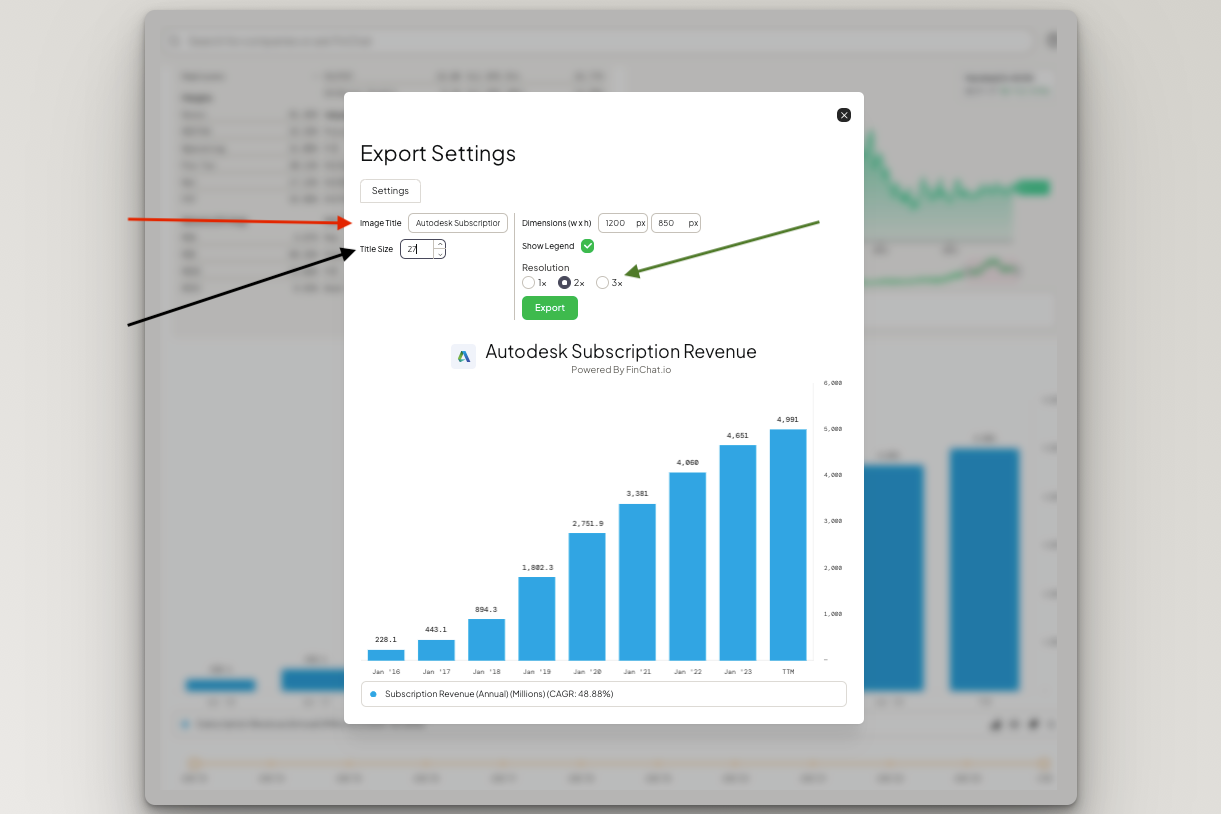
Once you select the metric you'd like to visualize, select the "Chart" button with the camera icon below the graph to customize the image you'd like to export.
A smaller settings page should instantly populate where you can then apply an image title (shown by the red arrow), adjust the image size (shown by the black arrow), select the resolution you'd like to export the photo at (shown by the green arrow), and hit export to share your beautiful chart.
Step 5: Compare companies head-to-head
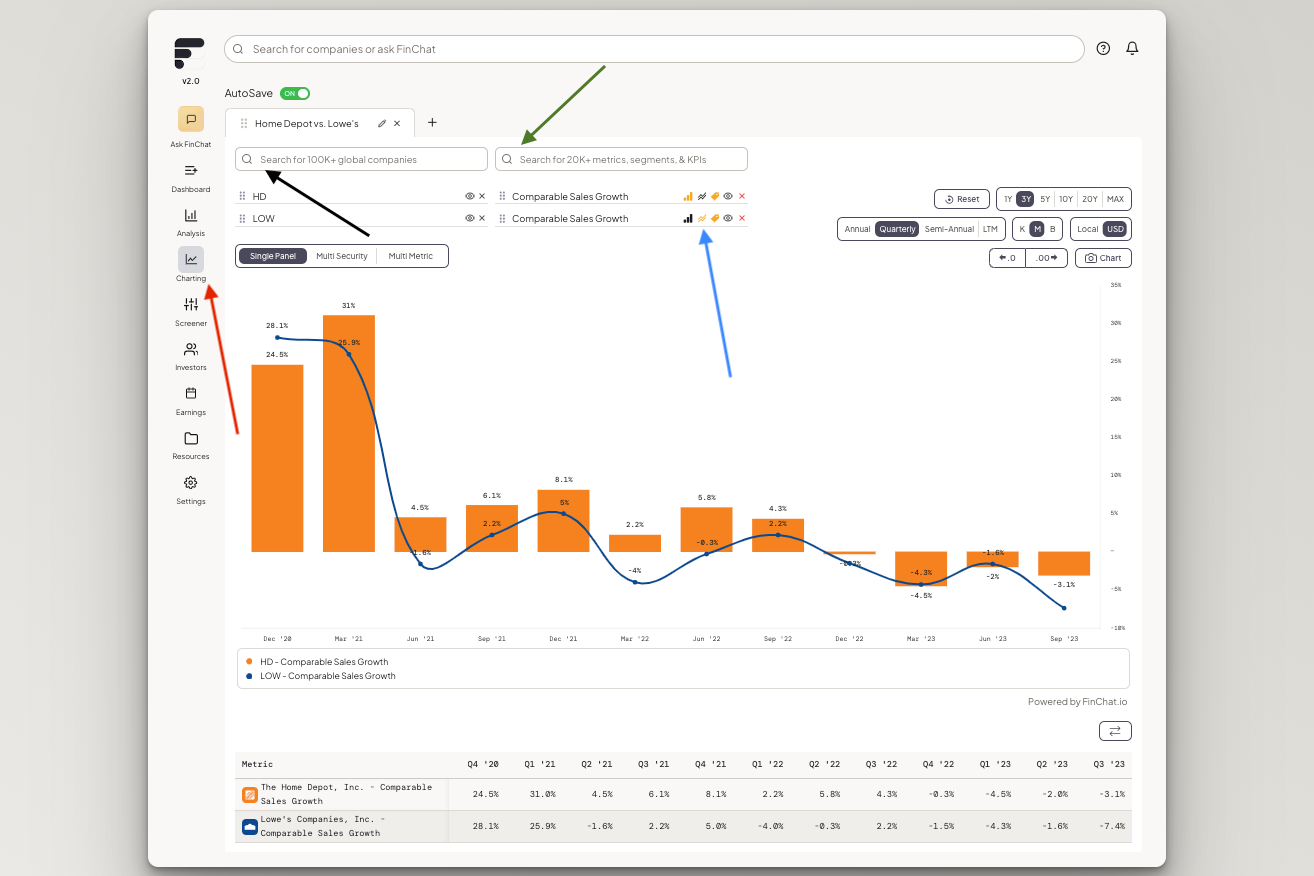
By using our fundamental charting tool (shown by the red arrow), you can compare the financial performances of any businesses among our 50,000+ stock database.
This is particularly helpful for visualizing the performance of a specific industry or set of competitors.
For example, if you want to see how Home Depot's same-store sales have performed against Lowe's same-store sales over the last 12 quarters, you can easily filter for that.
Search the businesses or tickers you're looking for in the company search bar (shown by the black arrow) and type-in or select the metrics you would like to visualize (shown by the green arrow).
You can also change the view to a bar graph or a line graph (shown by the blue arrow).
Step 6: Screener
The last tool we're going to talk about today is the screener.
If you like to discover new investments or generate new ideas based on specific criteria, this is the ultimate tool for you.
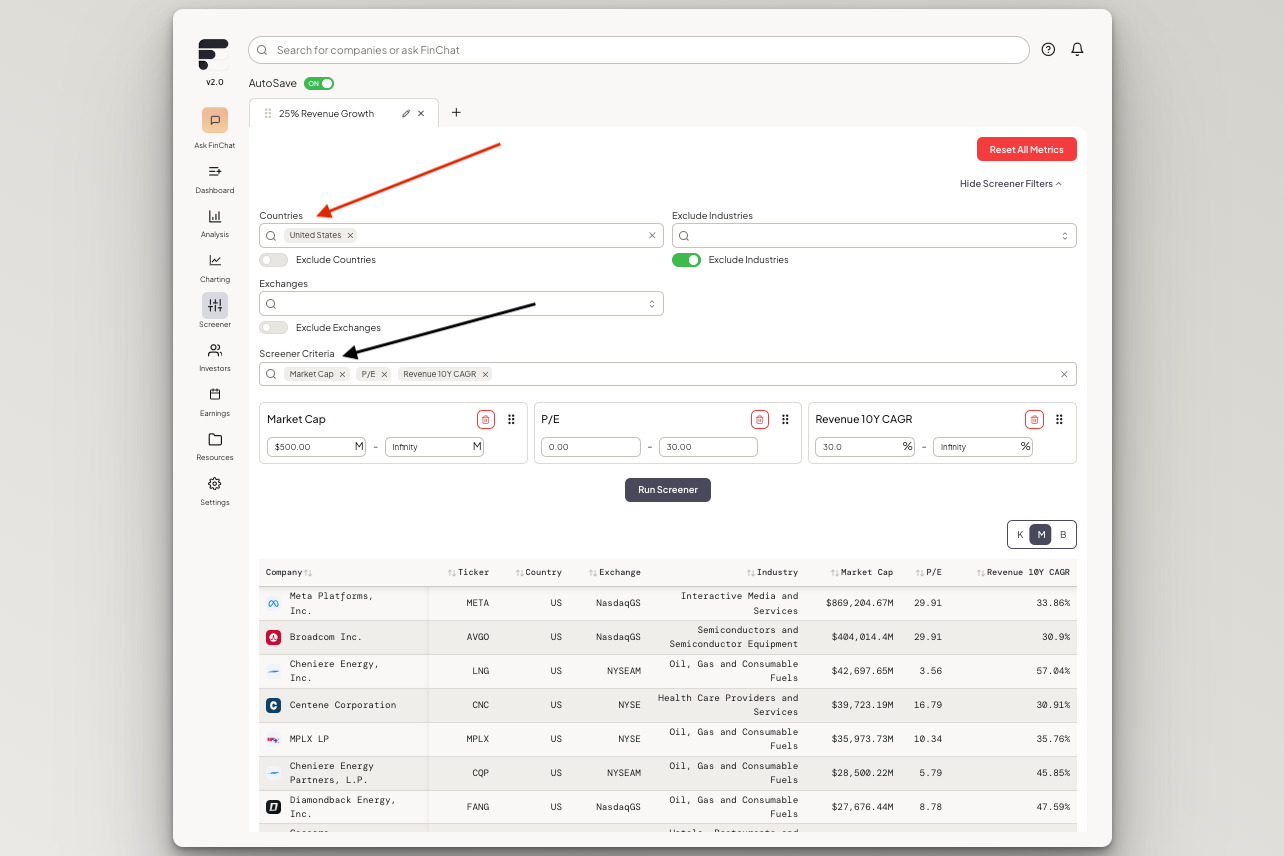
Our screener allows you to select from 200 different metrics to define your specific parameters.
Here's an example: Let's say you wanted to find all the US listed companies above a $500 million market cap that have grown revenue by more than 25% annually over the last 10 years, and trade at a current price to earnings multiple of less than 30x. Our screener will spit out all 19 companies that fit that criteria.
You would just need to filter by the country (red arrow) and then select the minimums and maximums for each of your metrics (black arrow).
And that's the basics!
With those 6 features (Dashboard, Analysis, Ask FinChat, Chart Sharing, Company Comparisons, and Screeners), you've got what you need to optimize your FinChat experience.
But it doesn't stop there. FinChat has tons of more useful products that we didn't get to today.
So test out FinChat for yourself and experience the power of our complete investment research platform!